US Religious Demographics
Mike Ervin
US Religious Demographics
Welcome back to class. Today will be a one week lesson on US Religious Demographics. What an exciting thing to do – study a bunch of statistics.
But if you have been paying attention to trends that have been going on for some time in the religious landscape in the United States you may be aware that there have been some unsettling trends developing in terms of attendance and participation in organized religion in both the world and in the US. We are not going to focus on the world today. It is a much more complex picture. And even in the US we will be focusing more on Christianity than other religions.
But particularly within Christianity in the US the recent trends have been disturbing so in our limited time we will try to take a fairly deep dive into religious and Christianity trends in the US. Hopefully you may then have a little better understanding of what has been going on.
Now to set the tone from the beginning let’s look at a fairly simple graphic.
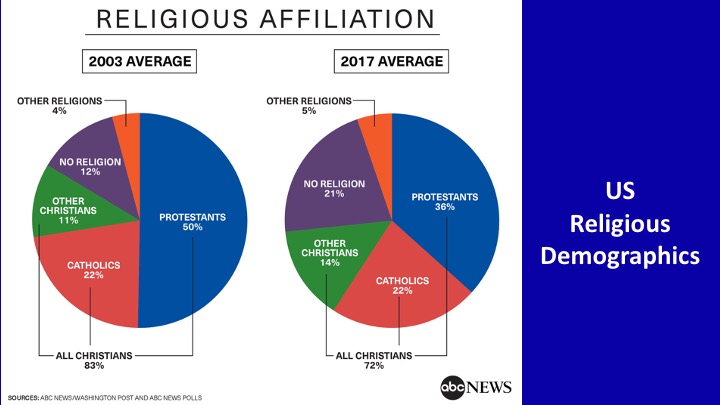
These are polls by ABC News and the Washington Post. This is two pie charts. The one on the left represents the numbers for 2003 on average. The one on the right represents the numbers for 2017 – a change over 14 years. Let’s focus on the left pie first. In 2003 50% of adults in the US gave their religious affiliation as Protestant. Catholics were 22%. Other Christians 11%. Let’s skip over No Religion for a moment and look at other religions – that number is 4% and includes Jewish, Muslim, Buddhist, Hindu, and a very small number of other non-Christians.
Now let’s look at the year 2017. Protestants have in only 14 years shrunk to 36%, a 14 % drop, and what has grown is the no religion category, which grew by 9%.
So this simple snapshot lays the groundwork for today’s investigation. What is going on with this 14% drop in Protestant affiliation and 9% gain in No religion?
Before we move on to more number analysis let me make a few comments about religious demographics that you should bear in mind. First a simple definition - Demographics - statistical data relating to the population and certain groups within it. There are many demographic studies that can be fairly precise and accurate. For instance the US census prepared every 10 years gathers a huge amount of data on every family in the US and it tends to be data that is clearly defined. But by law the census does not ask any religious questions.
Religious Demographics by contrast are rather notoriously “squishy”. And different pollsters ask slightly different questions that lead to varying results.
But most pollsters do not go to the denominations or the churches for the data because every denomination has different rules regarding who is a member. And many do not remove people from their membership roles for years after they stop attending or move so the numbers can be very unreliable. Pollsters go straight to the people with large scale telephone or internet polling.
Because of all of this the numbers from each polling group do not agree exactly, but the trends track fairly well.
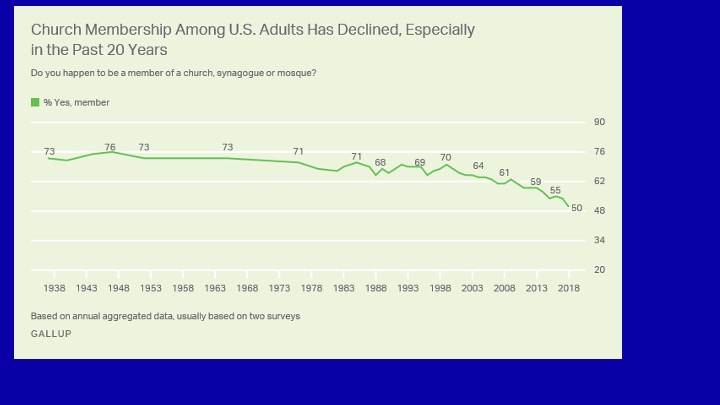
Here we see a much longer trend (81 years) from Gallup of Church membership. In this case the question asked is “Do you happen to be a member of a church, synagogue, or mosque?”
U.S. church membership was 70% or higher from 1937 through 1976, (39 years) falling modestly to an average of 68% in the 1978 through 1998 (20 years). The past 20 years (1998-2018) have seen an acceleration in the drop-off, with a 20-percentage-point decline since 1999 and more than half of that change occurring since the start of the current decade.

But now let’s take a little deeper dive into the denominational details. The Pew Religious Landscape Study is a major analysis that Pew does every 5 years. The 2020 study is not yet available. This is based on religious affiliation, which tends to be a higher number than membership.
Looking first at Christians, the Protestants, made up of Evangelicals, Mainline, and Historically Black Protestants, make up a total of 46.6% of the adult population. Next is Roman Catholic at 20.8%, followed by Mormons 1.6%, Orthodox Christians (Eastern Orthodox) at 0.5%, Jehovah's Witnesses at 0.8%.
These are the Christians. What about the remainder?
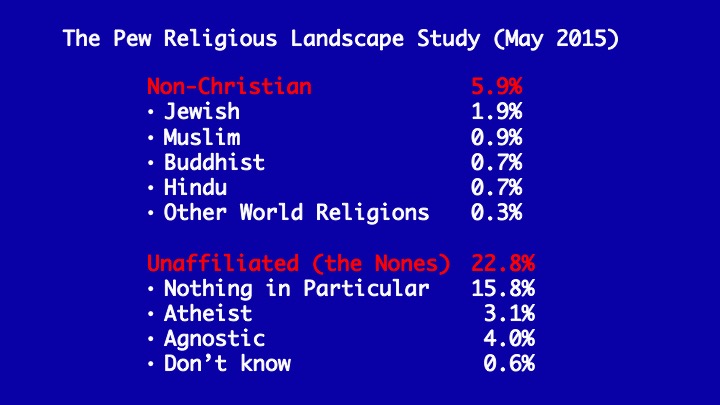
The Non-Christian is a total of about 5.9%. And is actually hardly changing over time. An interesting aspect of that is that pollsters like Pew also do separate polling asking US adults what they think the %'s are for the Non-Christian and that polling always shows that US citizens believe that these Non-Christian percentages are much larger than this and that they are growing rapidly. It is true that they are slowly growing in numbers, but because the entire population is growing the percentages remain pretty steady over time.
Finally then, looking at the final major category, the Unaffiliated, we see a very large number (22.8%) and one that is growing at a significant rate, as we saw on the opening slide. And this is made up of Atheists, Agnostics, and an expanding group of those who respond that they are no religion in particular.
It turns out that Pew's breakdown between Evangelical and Mainline Protestants is confusing to many so I will try to give you an idea with some examples.
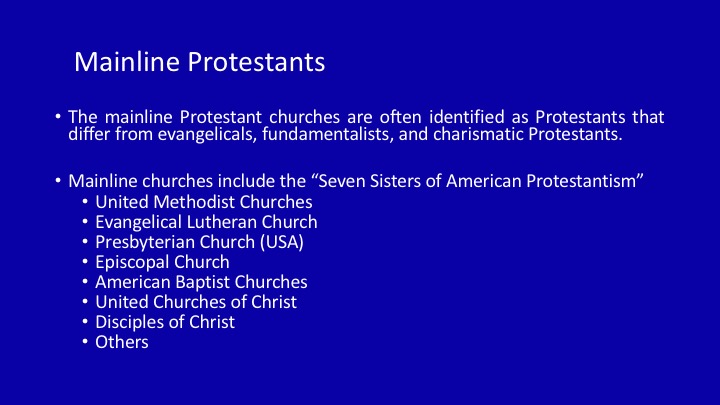
The Mainline churches include what is sometimes called the “Seven Sisters of American Protestantism”
United Methodist Churches
Evangelical Lutheran Church
Presbyterian Church (USA)
Episcopal Church
American Baptist Churches
United Churches of Christ
Disciples of Christ
Others
As you read this list recognize that it represents a deep division within US Christianity. It is a division that many of today's Christians may not be that familiar with in that it happened before most of us were born. When we get to the list for Evangelical Protestants on the next slide you will see several that sound a little like this list, except they are significantly different.
The Evangelical Lutheran Church on this list is quite different than the Lutheran Church - Missouri Synod on the next list, similarly the Presbyterian Church USA is quite different than the Presbyterian Church in America. And the American Baptist Churches are not the Southern Baptist Churches of the next slide.
We will talk about how this happened very early in the 20th century. Bit firt let's identify the major parts of the Evangelical Protestants.

Evangelical Protestants
Evangelical Protestants are a broad group that are traditionally much more conservative in their understandings of the Bible. They often list what they call their distinctives as: Conversionism (you must have a a born-again experience), Activism (in the mission field and in social reform), Biblicism (obedience to the Bible as the ultimate authority in all matters), Crucicentrism - a strong stress of the sacrifice of Jesus on the cross.
And some key examples:
Evangelicals
Southern Baptist Convention
Assembly of God
Church of Christ
Lutheran Church - Missouri Synod
Presbyterian Church in America
Many, many nondenominational and community churches. These vary widely and many are growing. Many of them mega-churches.
Mixture of Reformed, Holiness, Anabaptist, Pentecostal, Charismatic, others.
But now let me briefly go back in time to how and when these divisions happened.
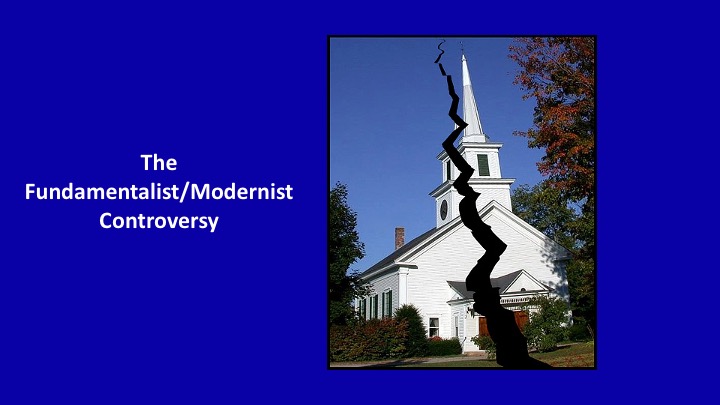
A few weeks ago Stacy Ikard gave us a brief overview of what happened to US Christianity at the beginning of the 20th century. And what it did is illustrated in this image of a church divided. Those divisions are still in place.
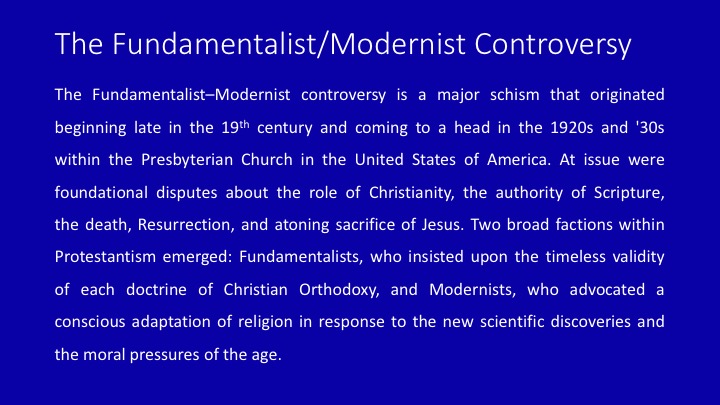
The Fundamentalist/Modernist Controversy
The Fundamentalist–Modernist controversy is a major schism that originated in the 1920s and '30s within the Presbyterian Church in the United States of America. At issue were foundational disputes about the role of Christianity, the authority of Scripture, the death, Resurrection, and atoning sacrifice of Jesus. Two broad factions within Protestantism emerged: Fundamentalists, who insisted upon the timeless validity of each doctrine of Christian Orthodoxy, and Modernists, who advocated a conscious adaptation of religion in response to the new scientific discoveries and the moral pressures of the age.
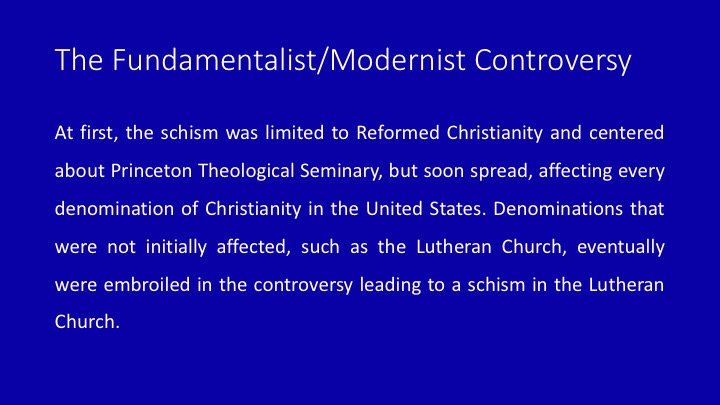
The Fundamentalist/Modernist Controversy
At first, the schism was limited to Reformed Christianity and centered about Princeton Theological Seminary, but soon spread, affecting every denomination of Christianity in the United States. Denominations that were not initially affected, such as the Lutheran Church, eventually were embroiled in the controversy leading to a schism in the Lutheran Church. It also split the Baptists.
So if you want to understand all of that better simply Google "The Fundamentalist/Modernist Controversy". It is a long and complicated story.
Now, let us return to the other major trend we introduced earlier - the growth of the Nones. Or as Gallup and Pew called it - "The Rise of the Nones"
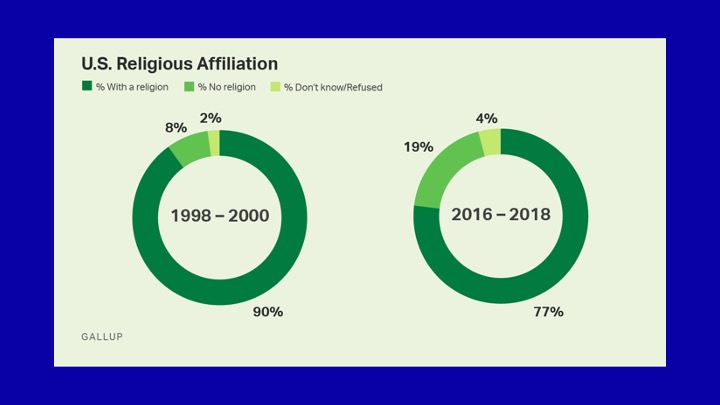
You can see it in the Gallup graphic. Between 200 and 2018 US religious affiliation dropped 13% and the "No religion" category or the Religiously Unaffiliated category grew by 11%. Let's explore it a bit.
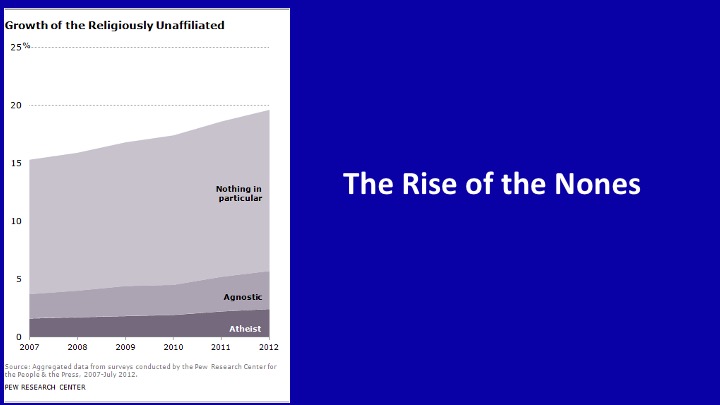
Pew Research reported on this in 2012 in a series of articles called "The Rise of the Nones". And showed this graphic of the changes between 2007 and 2012. I wil share a few of the quotes from those studies.
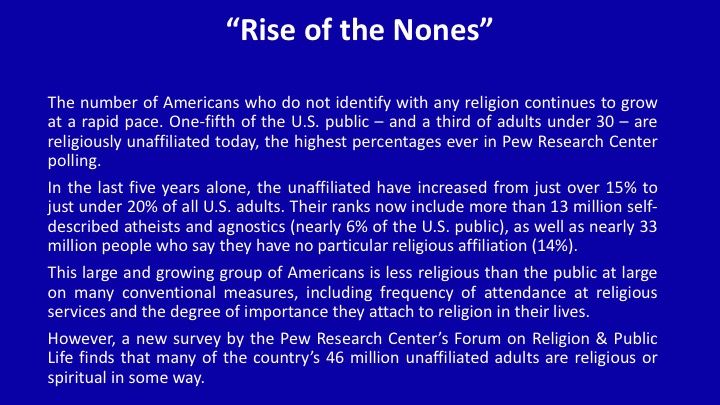
The number of Americans who do not identify with any religion continues to grow at a rapid pace. One-fifth of the U.S. public – and a third of adults under 30 – are religiously unaffiliated today, the highest percentages ever in Pew Research Center polling.
In the last five years alone, the unaffiliated have increased from just over 15% to just under 20% of all U.S. adults. Their ranks now include more than 13 million self-described atheists and agnostics (nearly 6% of the U.S. public), as well as nearly 33 million people who say they have no particular religious affiliation (14%).
However, a new survey by the Pew Research Center’s Forum on Religion & Public Life finds that many of the country’s 46 million unaffiliated adults are religious or spiritual in some way.
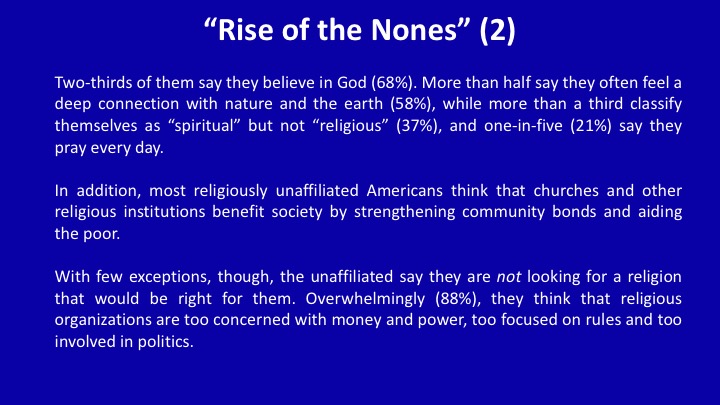
Two-thirds of them say they believe in God (68%). More than half say they often feel a deep connection with nature and the earth (58%), while more than a third classify themselves as “spiritual” but not “religious” (37%), and one-in-five (21%) say they pray every day.
In addition, most religiously unaffiliated Americans think that churches and other religious institutions benefit society by strengthening community bonds and aiding the poor.
With few exceptions, though, the unaffiliated say they are not looking for a religion that would be right for them. Overwhelmingly (88%), they think that religious organizations are too concerned with money and power, too focused on rules and too involved in politics.
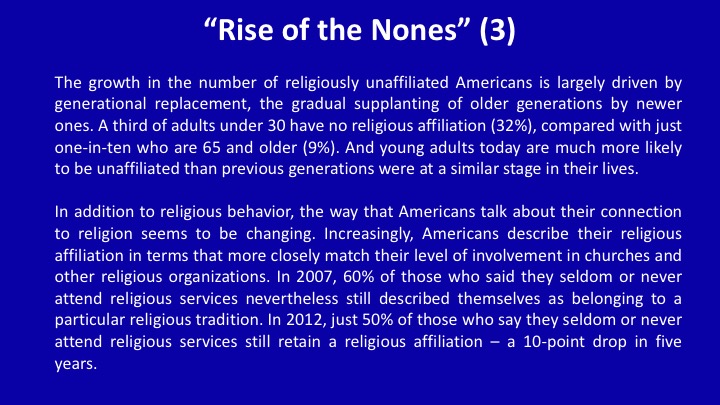
The growth in the number of religiously unaffiliated Americans – sometimes called the rise of the “nones” – is largely driven by generational replacement, the gradual supplanting of older generations by newer ones. A third of adults under 30 have no religious affiliation (32%), compared with just one-in-ten who are 65 and older (9%). And young adults today are much more likely to be unaffiliated than previous generations were at a similar stage in their lives.
In addition to religious behavior, the way that Americans talk about their connection to religion seems to be changing. Increasingly, Americans describe their religious affiliation in terms that more closely match their level of involvement in churches and other religious organizations. In 2007, 60% of those who said they seldom or never attend religious services nevertheless described themselves as belonging to a particular religious tradition. In 2012, just 50% of those who say they seldom or never attend religious services still retain a religious affiliation – a 10-point drop in five years.
These trends suggest that the ranks of the unaffiliated are swelling in surveys partly because Americans who rarely go to services are more willing than in the past to drop their religious attachments altogether.
Regarding how these changes are also driven by generational replacement, the gradual supplanting of older generations by newer ones. Let's look at how that happens.
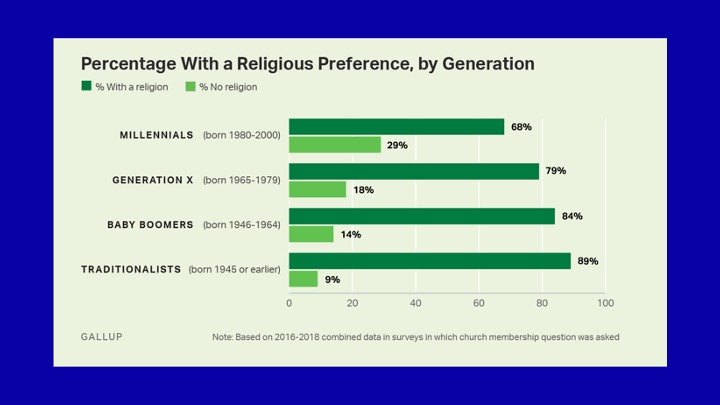
The percentage of adults who do have a religious preference varies widely based on your generation. In this 2018 data 89% of people born before 1946 answer that they have a religion. By contrast only 68% of Millennials (born between 1980-2000) answer in that way and 29% answer no religion. This is important because other polling of these Millennials indicates that unlike previous generations the "no religion" group are not looking for a church home, which if true will drive further growth of the Nones.
And their is one other group that is growing in this polling. It is not confined to the Nones but is changing the Landscape further. It is the "Spiritual But Not Religious" group.
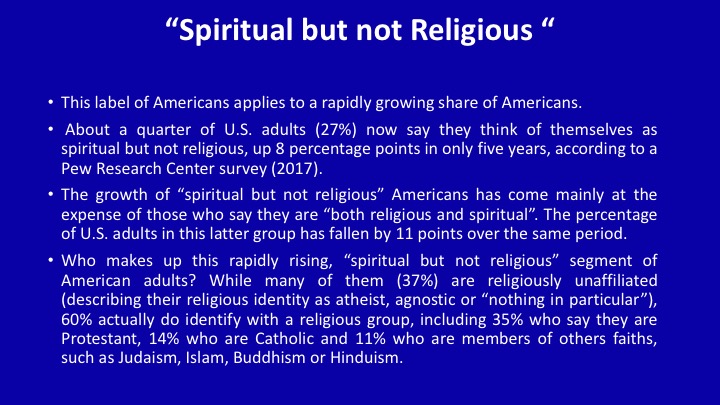
Some people criticize the term “spiritual but not religious” as rather wishy washy, but others embrace it as an accurate way to describe themselves. What is beyond dispute, however, is that the label applies to a growing share of Americans.
About a quarter of U.S. adults (27%) now say they think of themselves as spiritual but not religious, up 8 percentage points in only five years, according to a Pew Research Center survey.
The growth of “spiritual but not religious” Americans has come mainly at the expense of those who say they are both religious and spiritual. Indeed, the percentage of U.S. adults in this latter group has fallen by 11 points between 2012 and 2017.
Who makes up this rapidly rising, “spiritual but not religious” segment of American adults? While many of them (37%) are religiously unaffiliated (describing their religious identity as atheist, agnostic or “nothing in particular”), most actually do identify with a religious group, including 35% who say they are Protestant, 14% who are Catholic and 11% who are members of others faiths, such as Judaism, Islam, Buddhism or Hinduism.
One other aspect of Religious Demographics I want to touch on before we finish is the polling work directed to "Christians only" to ascertain their varying views on views. One aspect of that is what Christians say about the Bible.
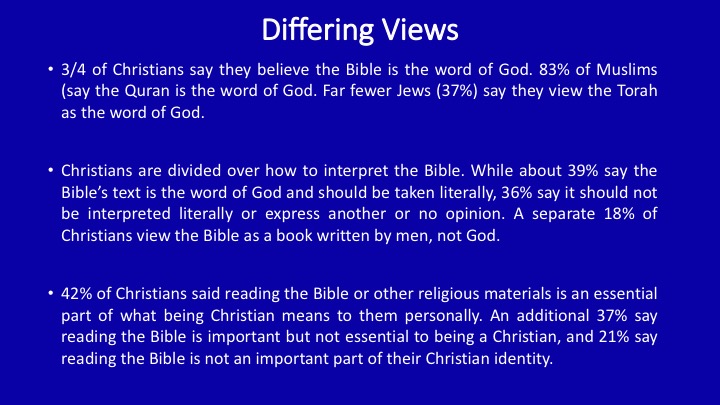
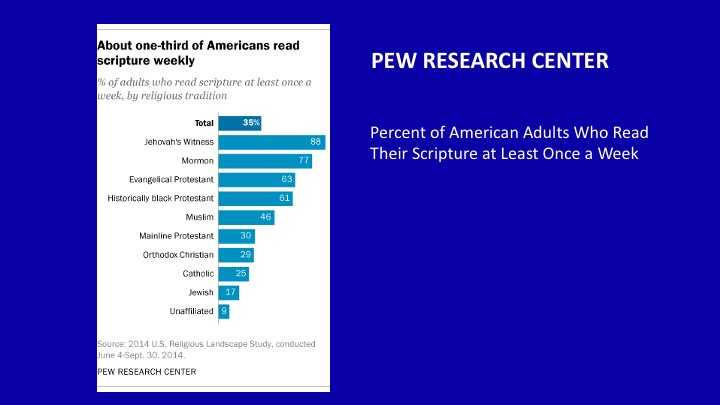
3/4 of Christians say they believe the Bible is the word of God. 83% of Muslims (say the Quran is the word of God. Far fewer Jews (37%) say they view the Torah as the word of God.
Christians are divided over how to interpret the Bible. While about 39% say the Bible’s text is the word of God and should be taken literally, 36% say it should not be interpreted literally or express another or no opinion. A separate 18% of Christians view the Bible as a book written by men, not God.
42% of Christians said reading the Bible or other religious materials is an essential part of what being Christian means to them personally. An additional 37% say reading the Bible is important but not essential to being a Christian, and 21% say reading the Bible is not an important part of their Christian identity.